A decade later: Have England’s youngest adults closed the international literacy and numeracy skills gap?
Thursday 24 April 2025

In 2012, 16 to 24 year olds in England were among the lowest performers internationally in literacy and numeracy. What has happened to this cohort of young adults a decade on? Have they managed to close the gap with their international peers?
In December 2024, we reported England’s findings from cycle two of the OECD Survey of Adult Skills. As a result of the findings from cycle one in 2012, there has been considerable policy focus on raising literacy and numeracy skills in school education. With success. In 2023, our young adults (aged 16-24) significantly outperformed young adults across the OECD on average in both literacy and numeracy.
We predicted that adults in England aged 16-24 in 2012 would rapidly gain skills in their 20s. This was previously found for the youngest adults in England who participated in a comparison of adults’ skills in 1996 - compared with the same cohort 16 years later in cycle one of the Survey of Adult Skills in 2012 [1].
In this blog we compare the results of 16-24 year olds in 2012 with 25-34 year olds [2] in 2023 to understand whether gains are consistent, or if any particular groups have been left behind, and how these adults compare with their international peers.
Key finding 1: Young adults in England have made larger skill gains in their post-compulsory education and early careers than young adults in other countries.
We found that the cohort of youngest adults who were aged 16-24 in 2012 developed their skills by 2023 (by which point they were in the 25-34 aged cohort), making large and significant gains in literacy and numeracy.
Table 1 Average literacy and numeracy scores in England for 16–24 year olds in 2012 compared with 25-34 year olds in 2023
| Cycle 1 ‘Young Adults’ (16 to 24 year olds) average attainment | Cycle 2 ‘Adults’ (25 to 34 year olds) average attainment | Difference | |
| Literacy | 265 | 285 | 19 * |
| Numeracy | 256 | 280 | 24 * |
Asterisk (*) indicates the difference is statistically significant at the 5% level.
Source: OECD, PIAAC 2023 database
Internationally, this group are also strong performers in literacy and, to a lesser extent, numeracy by 2023.
Figure 1: Average literacy scores across countries for 16-24 year olds in 2012 compared with 25-34 year olds in 2023
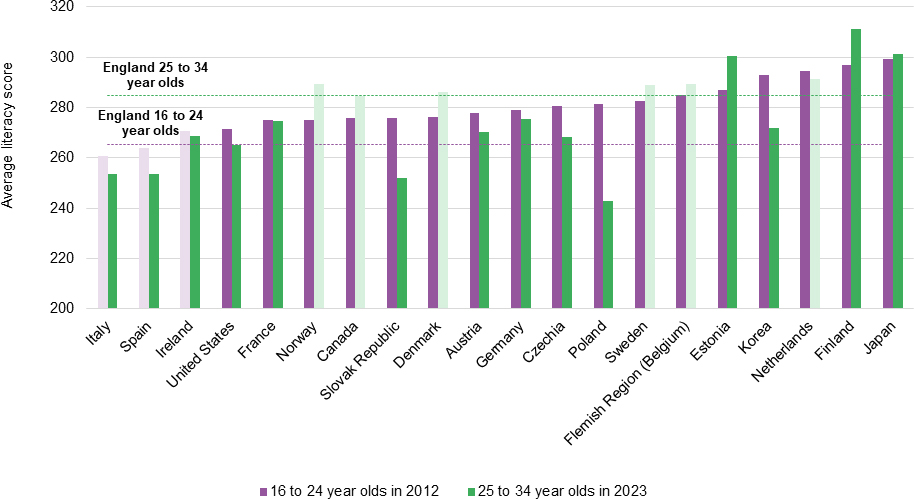
Note: a darker shade indicates the score is significantly different from England’s.
Caution is required in interpreting Poland’s results due to the high share of respondents with unusual response patterns. See the Note for Poland in the Reader’s Companion (OECD, 2024).
Source: OECD, PIAAC 2023 database
Figure 2: Average numeracy scores across countries for 16-24 year olds in 2012 compared with 25-34 year olds in 2023
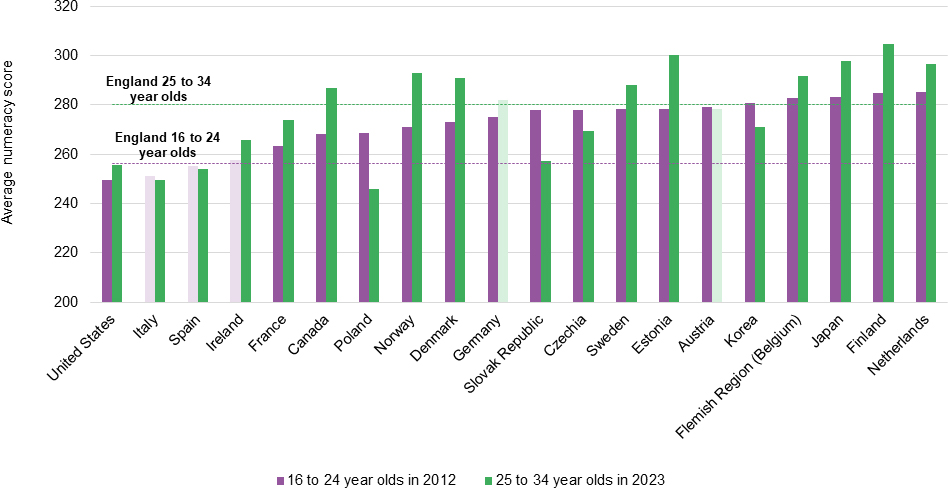
Note: a darker shade indicates the score is significantly different from England’s.
Caution is required in interpreting Poland’s results due to the high share of respondents with unusual response patterns. See the Note for Poland in the Reader’s Companion (OECD, 2024).
Source: OECD, PIAAC 2023 database
If we compare performance of adults in England with only countries which took part in both 2012 and 2023, we find that not only have our youngest adults gained skills in literacy and numeracy, their jump in skills has also been larger, so that adults aged 25-34 have overtaken their peers in other countries. In literacy, 16-24 year olds in England were among the lowest performers in 2012 but only adults aged 25-34 in Estonia, Japan and Finland outperformed adults in England in 2023. Similarly in numeracy, 16-24 year olds were among the lowest performers in 2012 but they outperformed adults aged 25-34 in nine countries in 2023.
We will now look at what has happened within the 16-24 year old cohort in 2012 as they transitioned into the 25-34 year old cohort by 2023.
Key finding 2: The skills gap between the highest and lowest achievers has not changed significantly since 2012.
When we look at the gap between the highest and lowest achievers in literacy in England (that is, the gap between the 10th and 90th percentile), there is evidence that improvements have been greatest for the highest performing adults (at the 90th percentile).
Figure 3: Gap between the highest and lowest performing adults in literacy
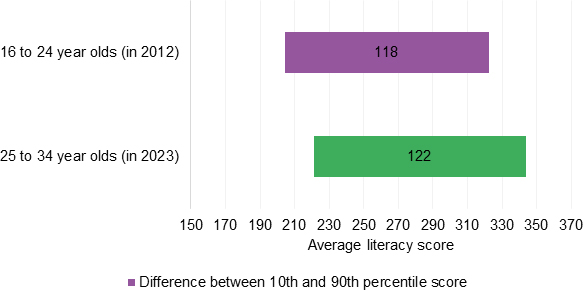
Source: OECD, PIAAC 2023 database
The highest performing adults (i.e. those scoring at the 90th percentile) aged 25-34 in 2023 scored 21 points higher than the highest performing adults aged 16-24 in 2012 and this difference is statistically significant. The 17-point increase for the lowest performing adults (at the 10th percentile) was not statistically significant. As a consequence of these changes in score, the gap between the highest and lowest performing adults has not changed significantly over time (118 in 2012 compared to 122 in 2023).
Therefore, although there is some indication that skills gain has been greater for the highest performing adults, this has not translated into a widening of the gap between the highest and lowest performing adults.
Key finding 3: The highest and lowest achievers have both made large gains in numeracy skills.
Figure 4: Gap between the highest and lowest performing adults in numeracy
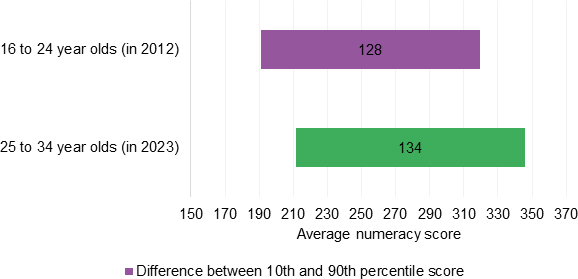
Source: OECD, PIAAC 2023 database
In numeracy, the highest performing adults (i.e. at the 90th percentile) aged 25-34 in 2023 scored 26 points higher on average than the highest performing adults aged 16-24 in 2012. Similarly, the lowest performing adults (at the 10th percentile) aged 25-34 in 2023 saw improvements, with the average numeracy score being 21 points higher than the lowest performing adults aged 16-24 in 2012. Both these differences are statistically significant.
The gap between highest and lowest performing adults has not increased significantly between 2023 and 2012.
Key finding 4: In 2012, 26 per cent of the youngest adults had low skills in numeracy. In 2023, this has dropped to 15 per cent in this cohort.
Adults with low proficiency in literacy and numeracy were those whose scores placed them at PIAAC Level 1 or below [3]. Adults achieving Level 1 or below in literacy struggle to complete tasks involving longer texts with distracting information. Adults achieving Level 1 or below in numeracy struggle to complete mathematical tasks with distracting information or conduct multi-step mathematical processes.
Figure 5: Percentage of low and high skilled adults
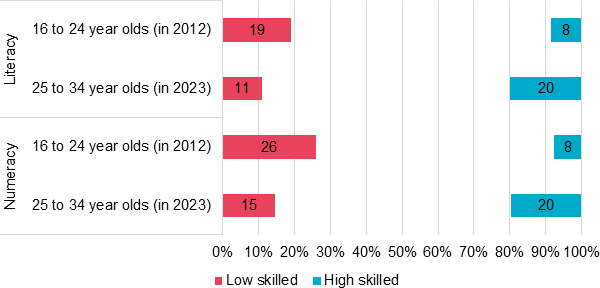
Source: OECD, PIAAC 2023 database
As shown in figure 5, there has been a larger decrease in adults with low skills in numeracy than literacy. However, the proportion of adults with low skills in numeracy was much larger than literacy in 2012.
Twenty per cent of adults aged 25-34 had high proficiency in literacy and numeracy, 12 percentage points higher than 16-24 year olds in 2012.
Key finding 5: Men and women aged 25-34 in 2023 had significantly higher scores in literacy and numeracy than men and women aged 16-24 in 2012.
If we compare the difference in scores between men and women aged 16-24 in 2012 and between men and women aged 25-34 in 2023, there is no evidence that either men or women have made bigger gains in literacy or numeracy.
However, the wide gap in numeracy skills between men and women that was present in 2012 persists, with men having better numeracy skills than women in 2012 and 2023, on average.
Figure 6: Average scores by gender
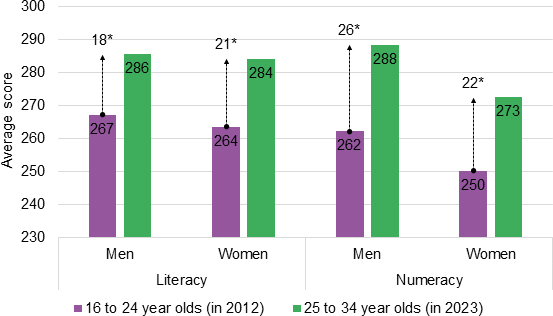
Asterisk (*) indicates the difference is statistically significant at the 5% level.
Source: OECD, PIAAC 2023 database
Key finding 6: As for 16-24 year olds in 2012, adults who grew up with fewer books at home continue to have lower skills aged 25-34 than adults who had more books at home.
The number of books at home is often used as a measure of socio-economic status. Adults who grew up with more books at home at age 14 years had higher literacy and numeracy skills, on average, than those who grew up with fewer books, and these differences persist.
Figure 7: Average scores by number of books at home at age 14 years
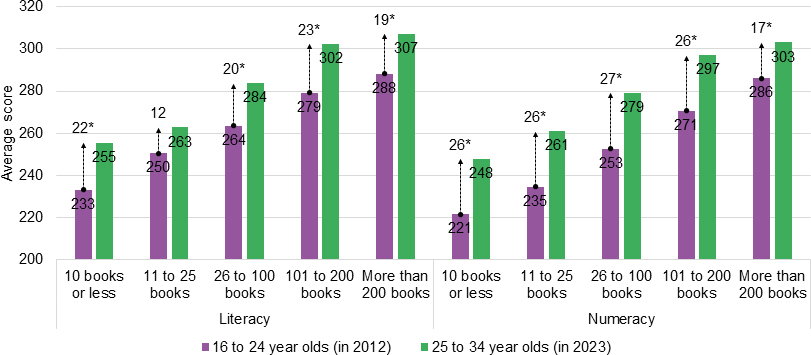
Asterisk (*) indicates the difference is statistically significant at the 5% level.
Source: OECD, PIAAC 2023 database
Adults in all groups made significant gains in literacy skills, except for adults who reported 11 to 25 books at home aged 14.
Gains in numeracy skills were very consistent across groups, except for the adults who reported the most books at home (more than 200), who made smaller gains, on average.
Key finding 7: The gap between adults with the lowest levels of education and those with either upper secondary or tertiary level qualifications is substantial, and their literacy and numeracy skills remain stubbornly low.
The gap between high and low educated adults is complicated to unpick as, inherently, the opportunity to study higher levels of education increases with age. The youngest age group in 2012 contained young people still in school and working towards upper secondary qualifications, and only the oldest adults in that age group would have had the opportunity to complete tertiary-level qualifications. By the very nature of being older, the cohort in 2023 (aged 25-34 years) has had greater opportunity to complete secondary-level and post secondary-level qualifications, including via less traditional routes.
We see a significant increase in the literacy and numeracy skills of adults who have completed a tertiary-level qualification, but no significant change in skills for adults with upper secondary qualifications or below. As discussed above, these groups do not necessarily contain similar adults. However, the findings do show that the gap between adults with the lowest level qualifications and those with the highest level qualifications is substantial.
Figure 8: Average scores by educational attainment
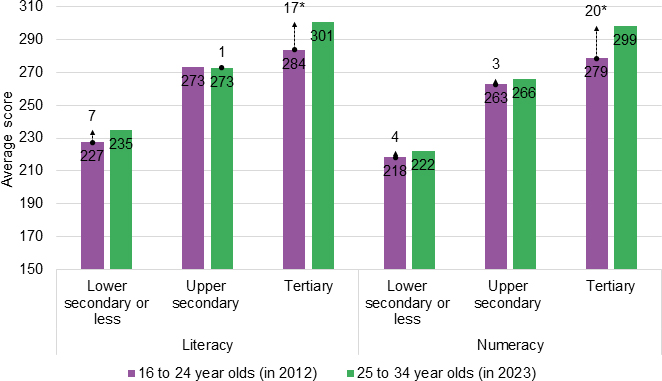
Asterisk (*) indicates the difference is statistically significant at the 5% level.
Source: OECD, PIAAC 2023 database
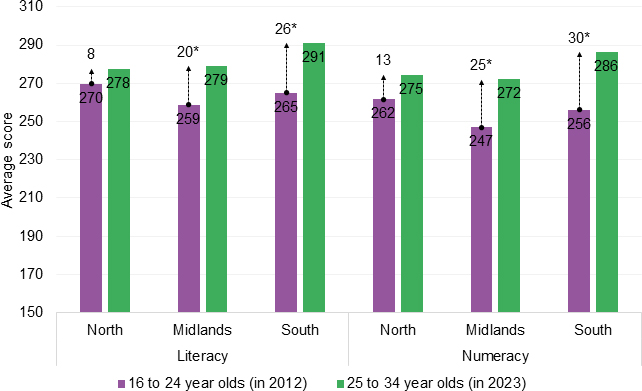
Key finding 8: Adults in the North of England aged 25-34 in 2023 have similar skills to adults aged 16-24 in 2012 in the same region.
The largest increases in literacy and numeracy skills were between 16-24 year olds and 25-34 year olds in the South. There were no significant differences between the skills of these age groups in the North.
There are many possible reasons for these findings to further explore, including considering young people’s movement for work and education, the types and availability of jobs in different areas of the country and the training opportunities they offer, etc.
Figure 9: Average scores by region
Source: OECD, PIAAC 2023 database
Conclusion
In this initial exploration of the data, we find comparatively strong performance of adults in England 10 years on from the concerningly poor performance of youngest adults identified in 2012. The poor literacy and numeracy skills our youngest adults left compulsory education with have rapidly improved in post-compulsory education and early work. They have also improved more than young people in other countries.
There is some evidence that improvements in skills of adults with the lowest literacy skills, with the most disadvantaged backgrounds and lower than tertiary-level education are the most challenging to shift. Outcomes by broad region also identify large differences in literacy and numeracy skills for young people. In addition, while there have been notable improvements in literacy and numeracy, there are large and persistent gaps between the most and least disadvantaged adults.
We will be exploring this data more to track the exact cohort 11 years on and unpick the impact of adults new to the country, who have been included in our analysis for this blog, but did not experience the UK education system. Look out for publications in the next few months.
References
[2] For this analysis we use the 25-34 year old group as a proxy for the youngest cohort from 2012. Adults in England aged 16-24 in cycle 1 would be 27-35 in cycle 2.
[3] See this page for a full description of the PIAAC literacy and numeracy levels. The literacy and numeracy proficiency levels in the Survey of Adult Skills are not equivalent to England’s National Qualification Framework (NQF) levels in literacy and numeracy. A comparison between PIAAC levels in cycle 1 and NQF levels was carried out in the cycle 1 national report (Wheater et al., 2013) and a calibration is available in Appendix G, Table G1 of that report.