Spotlight on multi-academy trusts: A glimpse into performance
Friday 2 February 2018
In recent weeks, NFER has shone a spotlight on multi-academy trusts (MATs) through our blog series examining what we know about the position of MATs in the education landscape. This time last week, NFER’s Karen Wespieser highlighted that despite the Department for Education (DfE) releasing their latest statistics on MAT performance measures on 25 January, we are still yet to know how MATs are performing in terms of improving pupil outcomes. In this final blog in the series, we delve further into this issue.
Measuring MAT performance is tricky
Measuring performance in MATs over time is complicated. Firstly, the number of MATs which satisfy DfE’s inclusion criteria (namely that only MATs with three or more academies that have been in the MAT for at least three full academic years are included in the data) is constantly changing. Secondly, following transformational changes to the Key Stage 2 (KS2) and Key Stage 4 (KS4) accountability regimes in 2015-16, we only have two years of comparable performance data for the new headline performance measures, which makes it difficult to judge whether pupil outcomes in MATs are improving.
DfE did not include any MAT improvement measures in their latest statistical release as they deemed that two years of comparable data was insufficient to create a valid and robust measure of improvement over time. The rationale for DfE not publishing this improvement data at this time is plausible as users of these statistics may start to use them to judge MATs. This is to be avoided as any changes in MAT outcomes between the two years might be due to cohort differences rather than to any actions that the MAT may have taken.
Nonetheless, there is such a shortage of data and there is so much public interest in how MATs are performing in terms of improving pupil outcomes that making a comparison between years remains an important exercise. There is also the question as to how best to measure MATs’ performance across multiple years in a robust and consistent manner. We have therefore analysed the data that DfE published on 25 January to see whether any further insights might be obtained.
How can MATs’ performance be measured on a consistent basis?
As noted, as the number of MATs and academies in scope change markedly from one year to the next, comparisons across years can be difficult. An effective method to overcome this problem is to do a like-for-like comparison, whereby we only include MATs and academies within those MATs that were present in each of the years being compared. This approach, which is similar to the one that market analysts use when trying to calculate how annual profits compare for businesses like supermarket chains which are operating a multiple but variable number of stores across time, can provide a glimpse into whether outcomes are improving.
How have MATs changed in size?
We started by looking at how the MATs had changed in size between 2015-16 and 2016-17, broken down by the MATs’ size classification specified by Sir David Carter, the National Schools Commissioner:
- Starter Trusts – comprises up to five academies
- Established Trusts – comprises between six and 15 academies
- Regional Trusts – comprises between 16 and 30 academies
- System Trusts – comprises over 31 academies.
In DfE’s 2015-16 analysis, there were 95 primary focused MATs with KS2 measures and 47 secondary focused MATs with KS4 measures which were in scope and which aligned with their definition. We matched these to the 2016-17 data to identify the MATs and their academies that we had data for in both years. There were a few missing cases; either due to a MAT closing or an academy being re-brokered and no longer meeting the DfE’s criteria. We were able to match 93 primary MATs and 44 secondary MATs in 2016-17 to their 2015-16 data.
Figure 1: A third of primary and secondary MATs have increased in size, but secondary MATs are more likely to have decreased in size
Primary focused MATs:

Secondary focused MATs:
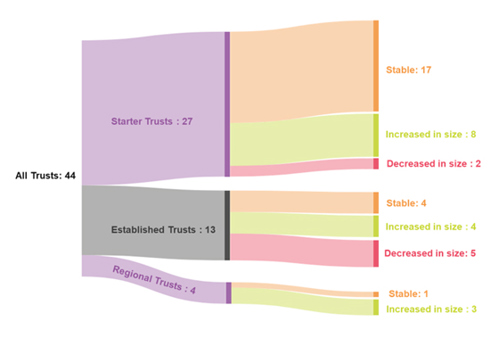
Source: Department for Education statistics 2015-16 and 2016-17
What is happening to MAT pupil outcomes?
Next, we looked at KS2 maths, reading and writing progress and KS4 Progress 8 for MATs that were present in both years. As shown in Figure 2, the average KS2 maths progress score, which was slightly above the national average in 2015-16 (note the national average was 0.00 for each KS2 subject), was unchanged in 2016-17. Progress in reading, which was below the national average in 2015-16, declined slightly further in 2016-17. Conversely, progress in writing, which was above the national average in 2015-16 for these primary MATs, showed a large increase in 2016-17.
Figure 2 also shows that at KS4, there has been a very marginal improvement in the Progress 8 score for the 44 secondary MATs present in both years. The Progress 8 score for these secondary MATs is marginally below the national average, which is -0.03.
Figure 2: There has been a large improvement in KS2 writing progress score
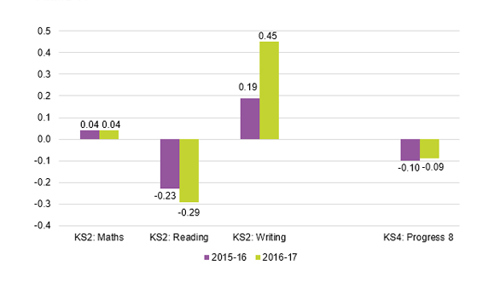
Source: Department for Education statistics 2015-16 and 2016-17
The aggregated KS2 progress scores by subject shown in Figure 2 disguises a lot of variability in progress scores between the two years for some MATs. We do not know whether this is due to cohort differences or to the specific actions these MATs took. There is less variability in MAT Progress 8 scores.
What can we conclude from this?
- The primary MATs which we have two years results are unchanged in maths and show a small decline in reading, which are the subjects that are independently tested. There has been a larger improvement in writing, which is teacher assessed.
- There has been very little change in progress made by the 44 secondary MATs between the two years.
- There were large variations in the KS2 subject progress scores for some MATs between 2015-16 and 2016-17. It will be important to continue to monitor these year-on-year changes to identify whether this variation settles down. If it does not, it may be difficult to robustly measure changes in primary MAT performance over time.
Finally, while the like-for-like method we have used can provide some insights into MATs’ performance across years, as some MATs are excluded from the measure, it would need to be used alongside other measures of MAT performance to give a rounded picture. We would suggest that the DfE carry out more research on possible measures and then set out publicly how they propose to measure MAT performance over time.