What happens when pupil numbers fall?
Wednesday 25 September 2024
 Falling pupil numbers can put pressure on schools’ finances. In our first blog looking at the profile across primary and secondary schools, we established that primary school pupil numbers are projected to decline over the coming years, albeit uncertainly.
In this next instalment, Michael Scott and Libby Tungate look particularly at primary schools and where numbers have already fallen sharply, the characteristics of the schools affected, and how the data suggests schools have responded when faced with such falls.
The Big Picture
What has happened to primary pupil numbers recently?
Nationally, state-funded primary pupil numbers have fallen by 1.5 per cent (around 70,000 pupils) since 2017/18. However, this masks a different picture at the regional level:
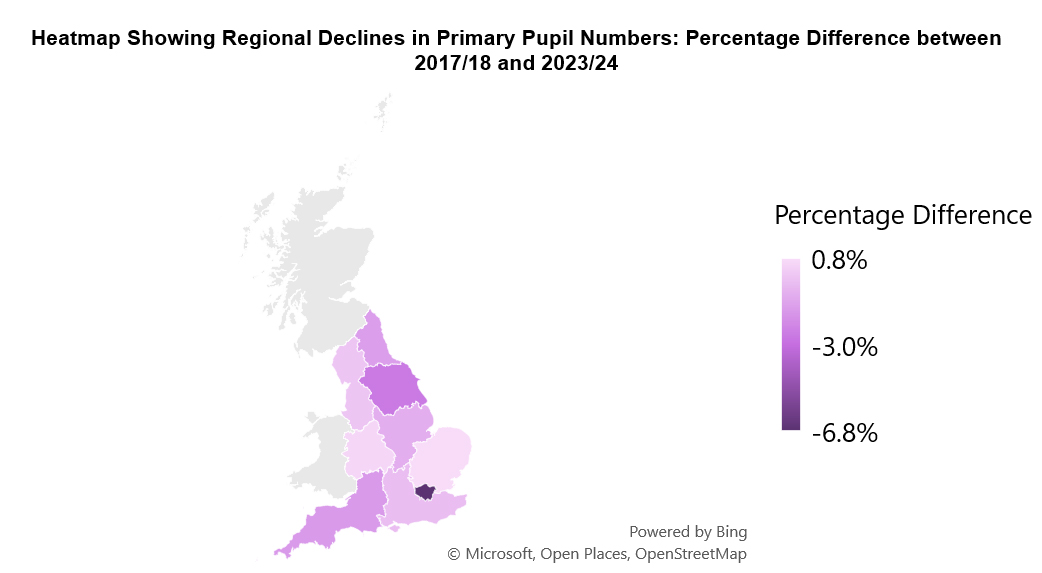
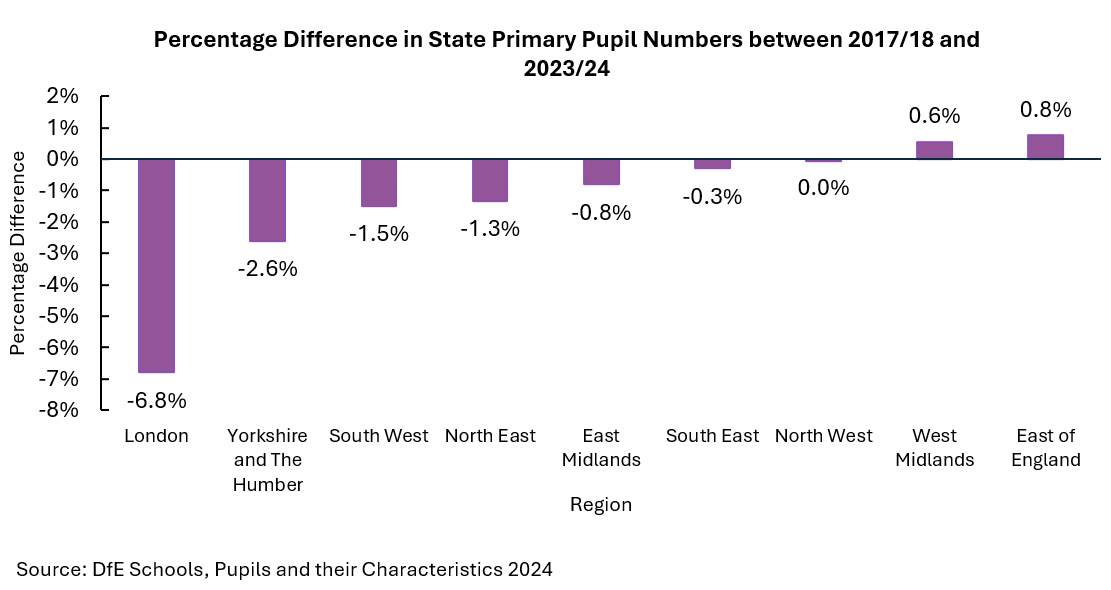
Firstly, we see that primary pupil numbers have not fallen everywhere: the West Midlands and the East of England have both seen small rises.
Of the seven remaining English regions that have experienced falls in their primary pupil numbers, most have seen decreases of less than 1.5 per cent, the national average.
However, London has experienced large falls, which has had a disproportionate impact on the national picture: numbers have fallen by about 50,000 in London alone, compared to 70,000 nationally.
What about on a local level?
The percentage decline at a local level is even larger in some areas, particularly within London. Indeed, the 10 local authorities (LAs) with the biggest declines in state primary pupil numbers have all been in the capital.[1]
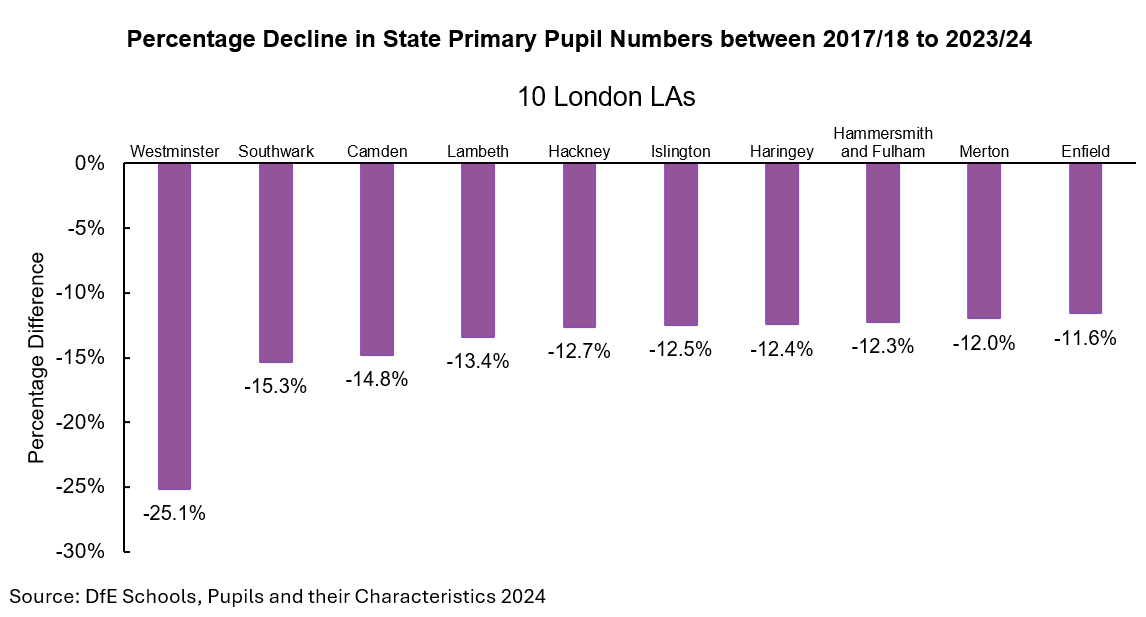
- Each of these LAs has had a fall in state primary pupil numbers greater than 10 per cent between 2017/18 and 2023/24.
- Westminster has had the largest decrease, although it should be noted that it is a relatively small LA with only 37 state-funded primary schools (as of 2023/24).
To look more widely at how falling numbers affect schools, we also identified the 10 LAs outside London with the biggest declines in primary pupil numbers, which we will also look at throughout our analysis:
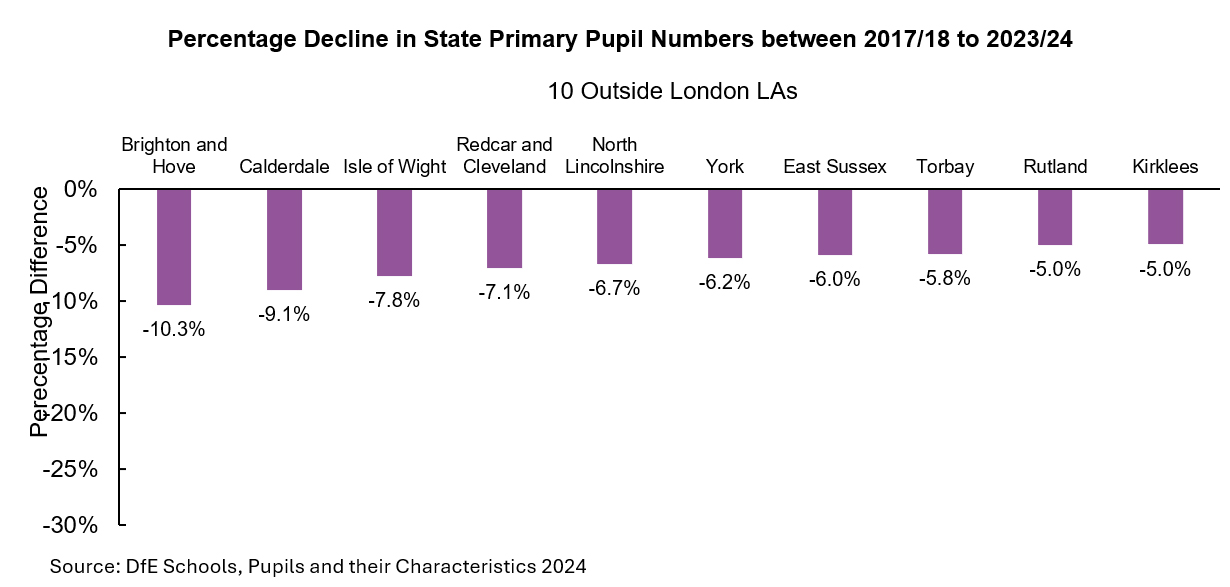
These LAs are based around the country, with the South East and North East both well-represented.
We are now going to look at whether this recent fall in pupil numbers varies across different schools, looking both at the national picture and LAs where pupil numbers have fallen the most.
School Characteristics
Do schools with higher Ofsted ratings tend to be ‘protected’ from falling numbers?
When inspecting schools, Ofsted makes judgments on how well schools are performing against their education inspection framework. These ratings have been used by parents when deciding which school they would prefer their children to attend [2].
We start by exploring whether the impact of falling primary pupil numbers varies by judgement on average. To do this, we look at how full schools were in each Ofsted group on average, as defined by Ofsted ratings in 2017/18 and 2022/23. [3]
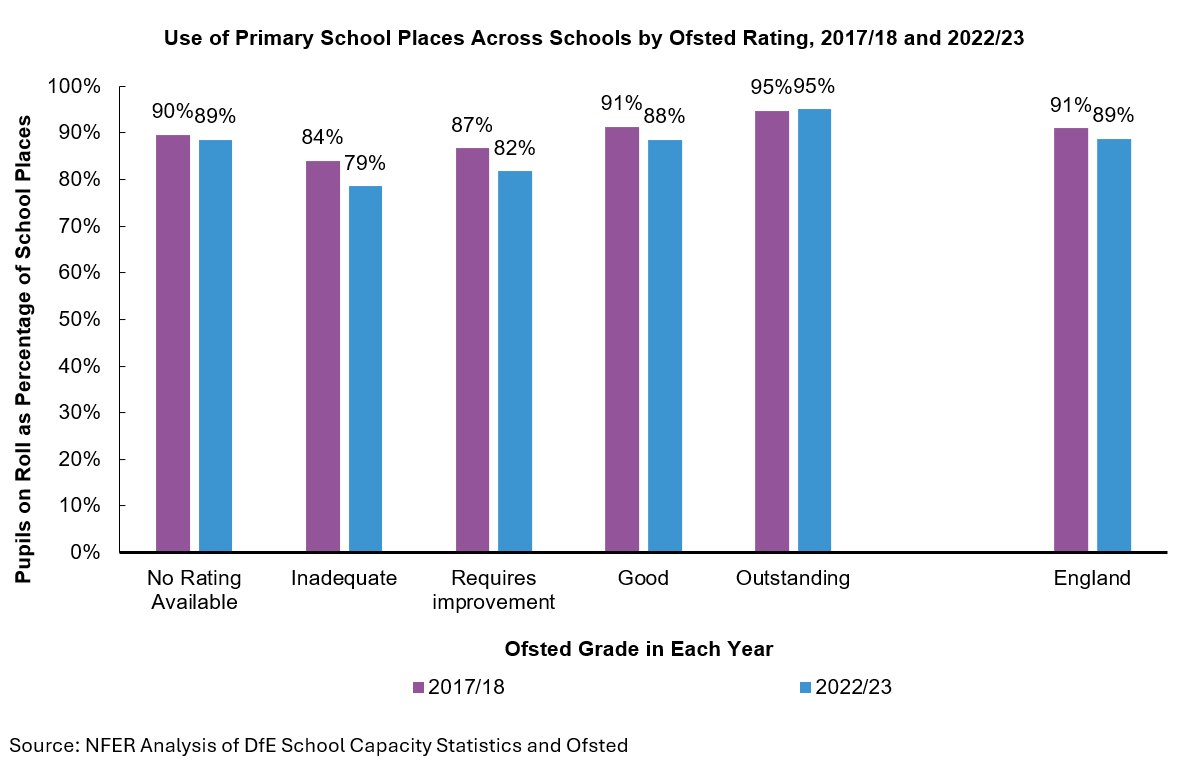
We can see that in 2017/18, primary schools in England were operating at 91 per cent of their capacity, but this had fallen to 89 per cent by 2022/23. At the same time:
- There was almost no change in the number of pupils in primary schools with an ‘Outstanding’ grade, relative to school places on average. These schools tend to have the least spare capacity, on average, too.
- The average school with a ‘Good’ grade tended to see a small increase in unused capacity, moving from being 91 per cent to 88 per cent full on average. These schools are roughly in line with the national average, which is not surprising given more than half of all primary schools in 2017/18 and 2022/23 were in this category.
- For schools with ‘Requires improvement’ or ‘Inadequate’ grades, there was quite a marked drop off in pupil numbers, relative to school places, on average. These schools tend to also have the most unfilled places on average. (Very few schools at any one time have an ‘Inadequate’ rating.)
The data suggests that state primary schools with lower Ofsted ratings are disproportionately impacted by falling pupil numbers, even after accounting for school capacity.
This may be because some parents are less likely to choose to send their children to a lower-rated school. DfE's statistics show that parental preferences in the primary sector are more likely to be met in recent years, probably because overall demand for places is falling while capacity has continued to increase.
This may explain why lower rated primary schools have been more affected by falling pupil numbers.
Are LA maintained schools and academies both similarly affected by falling pupil numbers?
We have also explored whether, when pupil numbers fall in a local area, LA maintained schools and academies in that area experience similar falls.
For context, LAs are responsible for providing a school place for each pupil in their local area. However, they do not have the same powers over academies as they do maintained schools when it comes to placing pupils to schools and capacity planning.
If we repeat the same analysis we did above, but split schools by whether they are academies or maintained in each year, we do not see a strong pattern:
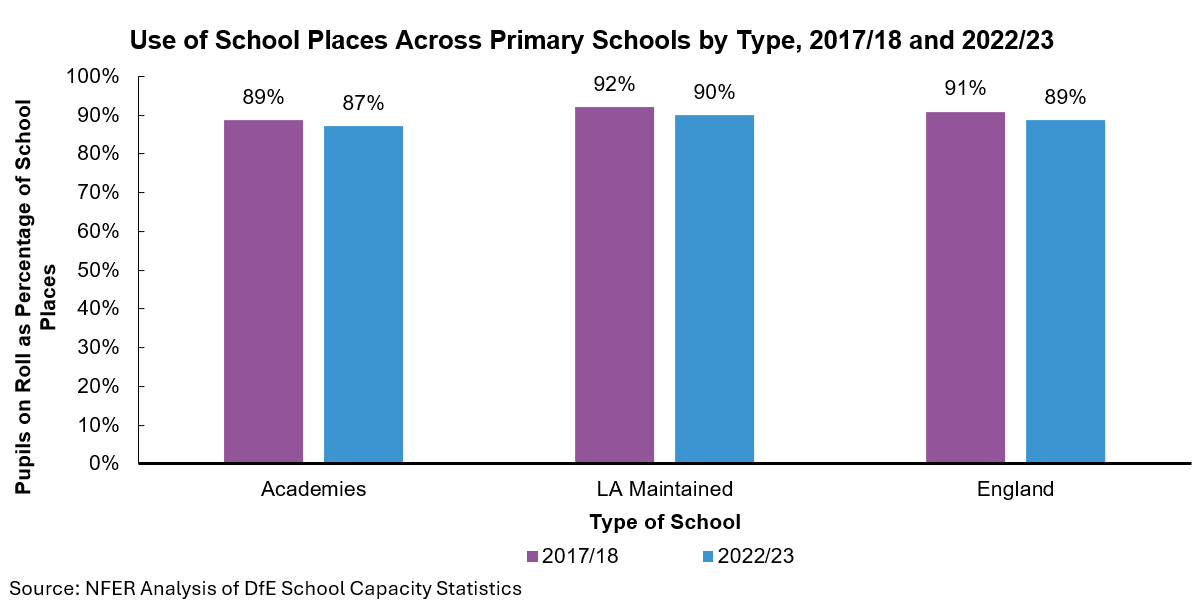
The chart above shows that, relative to the number of school places, the number of pupils in primary schools moves roughly in line with the national average regardless of whether the school is an academy or LA maintained and academies are slightly less full, on average.
However, this result could still be influenced by the composition of schools in each group. We have specifically looked at primary schools that were consistently an academy or consistently a maintained school between 2017/18 and 2023/24. (Many schools are not in either group because they changed status during this period.)
We also look at the 10 LAs inside and outside London with the largest falls in pupil numbers, as defined above. This is all presented in the following chart, which looks at the percentage point change in the metric used above between 2017/18 and 2022/23:
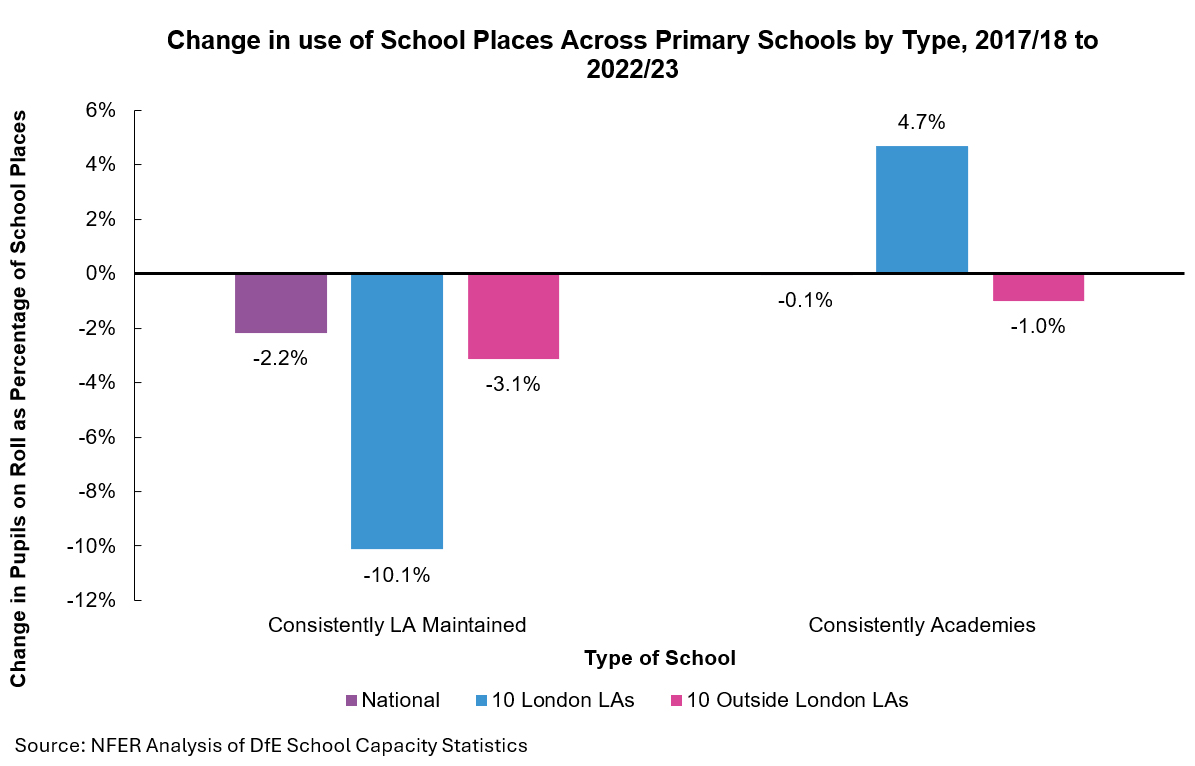
Our results show:
- Nationally, schools that are consistently academies appear to experience less of a fall than schools that were maintained throughout the period, relative to capacity. This was also true in both sets of LAs we looked at.
- In the 10 London LAs which experienced the largest falls, LA maintained schools saw the number of pupils fall very sharply on average (relative to capacity), but for academies this metric increases. It should be noted there are relatively few academies in these areas, compared to national averages.
- The LAs outside of London give a slightly different picture. Here, pupil numbers fell, relative to places, for both groups of schools, but they fell more sharply for those schools that were consistently LA maintained.
We wondered whether these results could be explained by Ofsted ratings (as above), but this doesn’t appear to be the case. The results did not significantly change when we only looked at schools with the same Ofsted grade in 2017/18 and 2022/23.
The evidence suggests LA maintained schools that have not changed status have tended to experience sharper declines in primary pupils on average when numbers are falling compared to schools that have been academies since 2017/18.
We cannot tell from the data why this is happening. Additional research is needed, including a review of changes in parental preferences over time and how admission numbers are determined between LAs and schools.
Furthermore, because there are different possible reasons, we shouldn’t assume that the pattern in the 10 London LAs will be repeated in other areas if they see similar falls in pupil numbers in future.
In sum, this data suggests LA maintained schools see larger falls in pupil numbers than the overall figures would imply. This makes the pressure of falling numbers even more acute for those schools.
Implications: How have schools responded to smaller numbers?
How are pupil falling numbers affecting class sizes?
With pupil numbers falling, class sizes could fall, which could help improve pupils’ outcomes. Alternatively, schools may reduce the number of classes and keep class sizes level. [4]
What does the data suggest has happened as pupil numbers have fallen? [5]
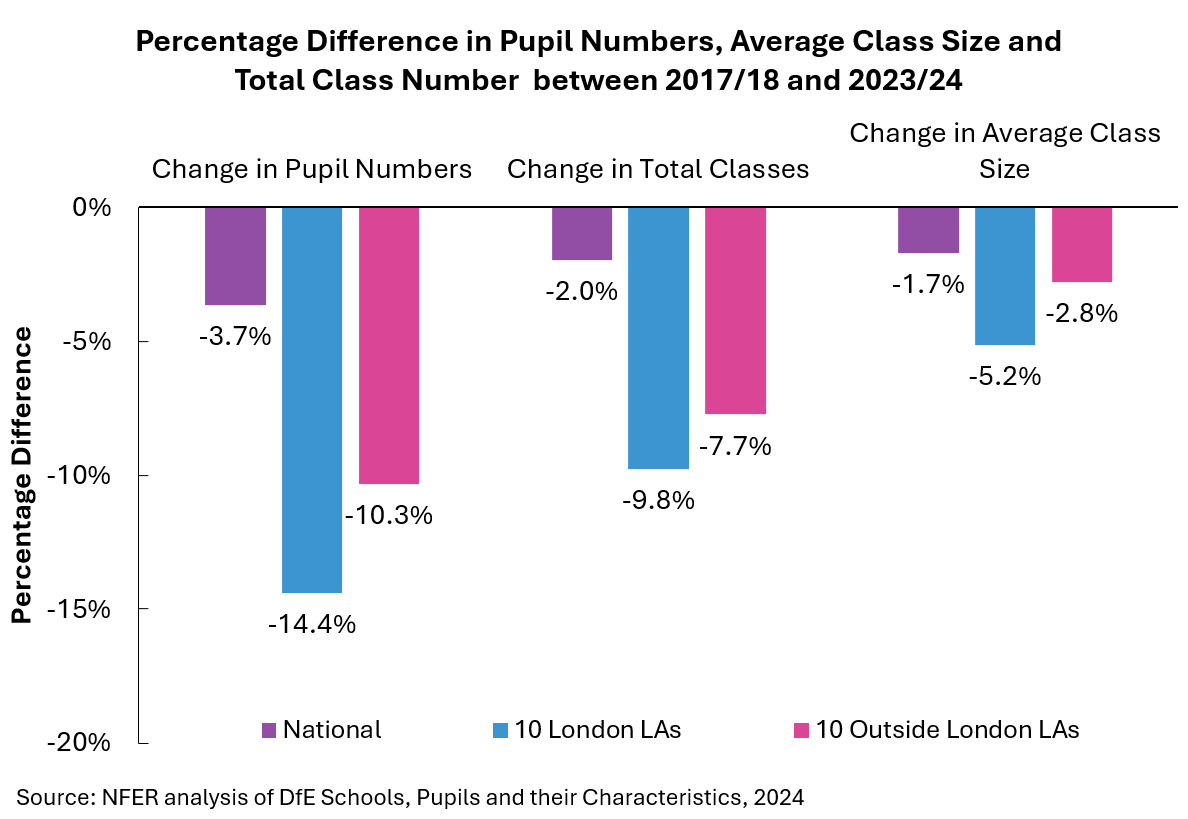
- In the data on class sizes, national state primary pupil numbers have fallen by 3.7 per cent between 2017/18 and 2023/24. Over the same period, the number of classes have fallen by two per cent. As a result, the average class size has fallen from 27.1 pupils per class to 26.6 (1.5 per cent).
- In the 10 London LAs with the largest falls, a 13.4 per cent fall in primary pupil numbers has been met with a 9.7 per cent fall in total classes. This has moderated the fall in the average class size, from 26.6 to 25.2 (a fall of around five percent).
- In the 10 LAs outside of London, there has been a 10.3 per cent decline in pupil numbers and a 7.7 per cent reduction in total classes. As a result, the average class size has fallen by comparatively less, at around three per cent.
Overall, our analysis suggests that primary schools respond to falling pupil numbers by reducing the total number of classes they have or the average class size.
The evidence from the areas where pupil numbers have fallen the most suggests schools prioritise cutting the number of classes, instead of reducing the number of pupils in each class. This is likely to be due to the financial challenge schools face when some classes are not full / it is not operating at capacity.
What does this mean for funding?
Revenue reserves capture the amount of money a school has at the end of the financial year. A deficit (or negative reserve) is when schools’ finances slip into the red.
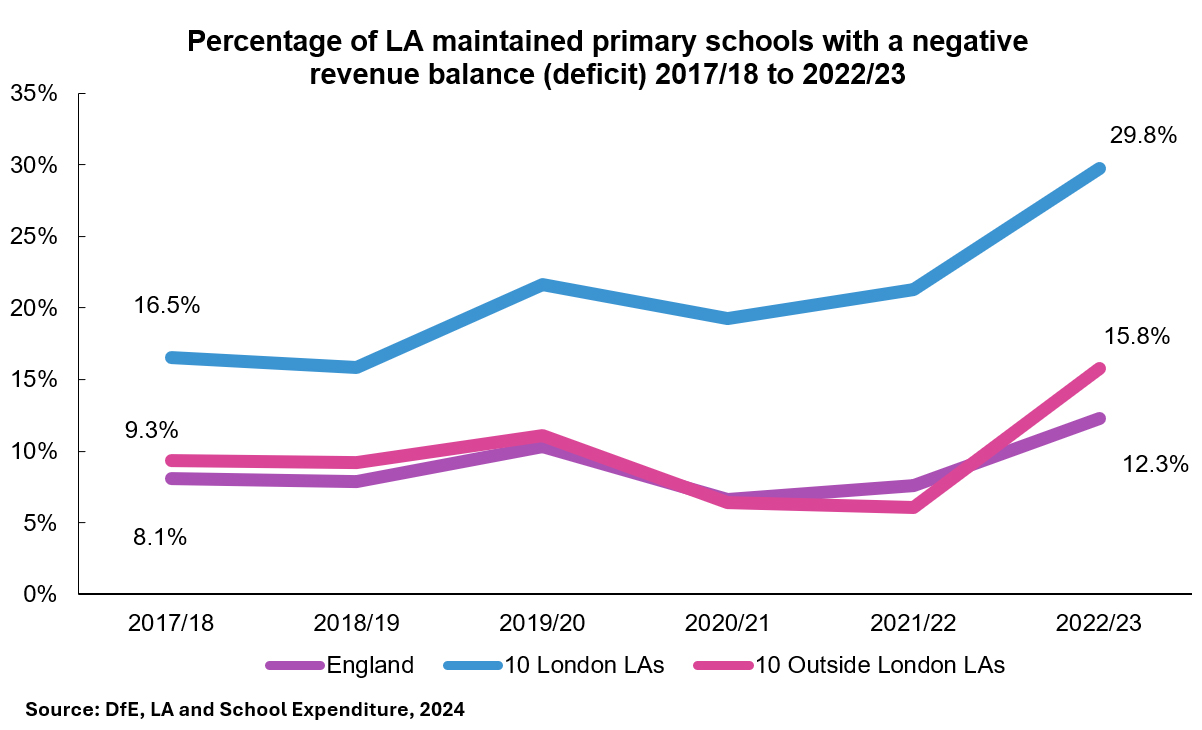
We find that:
- In England, 12 per cent of maintained primary schools had a deficit at the end of 2022/23. This has increased by around four percentage points since 2017/18.
- The evidence from the 10 LAs in London suggests that larger falls in primary pupil numbers leads to more schools going into deficit. Despite starting at a higher level in 2017/18, the proportion of primary schools in deficit has grown faster in these LAs than it has nationally.
- Primary school financial positions in the 10 LAs with the largest falls outside London have tended to track the national average, but this could be because there’s been less of a fall in pupil numbers in these schools.
Overall, whilst schools nationally have faced funding pressures, these pressures have been particularly acute in the LAs where numbers have fallen fastest.
What have we found?
In this blog, we have found that:
- The number of state primary pupil numbers are falling. London largely accounts for the national fall by itself, although most regions have seen some fall since 2017/18.
- Primary schools with lower Ofsted ratings have seen larger falls to primary pupil numbers than schools with higher ratings.
- There is some evidence that schools which have been consistently academies have been less impacted than schools that have been consistently maintained since 2017/18.
- When pupil numbers fall sharply, schools tend to prioritise reducing the overall number of classes, rather than the number of pupils per class.
- Revenue reserves data shows us, whilst there are funding pressures nationally, these have been exacerbated in areas of London with the largest falls in pupil numbers.
Look out for the final blog in this series coming up soon, where we will look at the relationship between pupil numbers and capacity at the local level.
Footnotes
[1] Please note LAs that underwent boundary changes during this period were not included in this analysis, not were City of London and Isles of Scilly as these LAs are very small.
[2] Note that the new government have recently announced that single headline Ofsted grades will no longer be published.
[3] At the time of the analysis, Ofsted grades for 23/24 were available to the end of June 2024.
[4] The reduction in the number of classes does not appear to be explained by school closures. Whilst there are slightly less primary schools, particularly in the 10 London LAs, the percentage fall in the number of schools is much smaller than the percentage fall in the number of classes.
[5] Please note that, in line with DfE statistics, the number of pupils in the class size data is different to the overall number of pupils. DfE say this is because class size data only includes pupils in classes taught by one teacher. As such, the changes in numbers here are different to those above.