Phonics results – Now that’s good news for young readers
Friday 29 September 2017
In the first year of the annual phonics screening check (PSC) in 2012, less than three-fifths of pupils achieved the expected standard. There was also a large variation in outcomes between different areas of the country. However, the latest PSC for primary pupils in England, published yesterday by the Department for Education (DfE), shows that many more pupils are now achieving the expected standard in 2017 and the wide variation previously seen has largely disappeared. This is good news, as the teaching of phonics is considered by the Department of Education to be the best practice to provide a secure foundation for the teaching of reading.
The percentage of pupils achieving the expected standard in the PSC nationally has been steadily increasing, from 58 per cent in 2012 to 81 per cent in 2017 (Figure 1). In 2013, the PSC was extended to Year 2 pupils who did not achieve the expected standard in Year 1. By 2017, 92 per cent of pupils had reached the expected standard by the end of Year 2.
Figure 1: National phonics screening check outcomes have been rising year-on-year since its inception
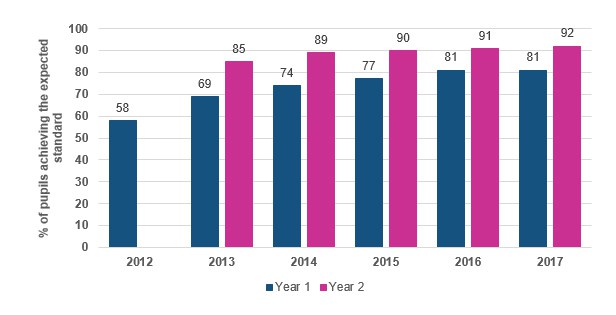
Source: Main text, Phonics screening check and key stage 1 assessments in England, 2017
The steady improvement pattern seen in the phonics results in the first few years after its introduction up to 2016 (see Figure 1) is not unusual when new assessments are introduced. Results generally improve as teachers get more experience of the assessments which they can draw on to help prepare their pupils.
Yesterday’s figures also enable us to look at the detail of how the results have changed below national level. This shows that the percentage difference in phonics screening outcomes between the highest and lowest performing Government Office Region (GOR) is largely unchanged at five per cent, despite the large increases seen in the percentage of pupils reaching the expected standard over the period.
Moving to looking beneath the regional picture, one striking observation from the 2012 data was the wide variation in PSC outcomes among local authorities (LAs). This ranged from 47 per cent in Medway to 72 per cent in Solihull – a range of 25 percentage points. By 2017, this situation had changed quite markedly (Figure 2).
Figure 2: The percentage of pupils achieving the expected standard in phonics has increased for all local authorities since 2012, but the distribution has narrowed
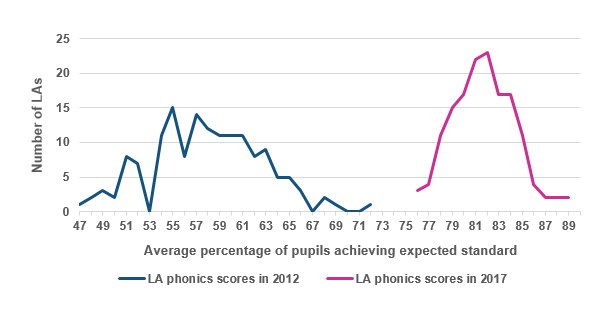
Source: Table 6, National Tables, Phonics screening check and key stage 1 assessments in England, 2017
As Figure 2 shows, there has been a large shift to the right in the distribution of LA PSC outcomes. Indeed, up until 2016 when the percentage of pupils achieving the expected standard was growing steadily, PSC outcomes improved in each successive year since it was introduced in all but seven LAs, which is extremely encouraging for young readers.
Figure 2 also shows the distribution of PSC scores by LA has narrowed markedly. Might this suggest that weaker performing LAs in 2012 have made more progress over the last five years than LAs which had initially performed strongly in 2012? We explore this in Figure 3 below. Here we ranked the 150 LAs with a reported PSC outcome (note the City of London and Isles of Scilly have been excluded as they do not have a reported PSC outcome), split the distribution up into fifths or quintiles (i.e. 30 LAs with lowest outcomes = quintile 1, next 30 = quintile 2, etc.), and calculated the average PSC outcome for each quintile. We then calculated the 2017 average PSC outcomes, where LAs were in the same quintile groups as in 2012.
Figure 3: LAs with lower PSC outcomes in 2012 have managed to close the gap with higher performing LAs in 2012.
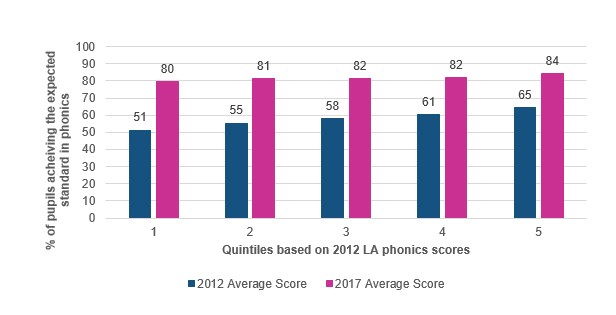
Source: Table 6, National Tables, Phonics screening check and key stage 1 assessments in England, 2017
Figure 3 confirms that LAs in the lower performing quintiles based on 2012 PSC outcomes have indeed made more progress over the last five years. By 2017, they have nearly managed to close the gap with the quintiles comprising the higher performing LAs from 2012. This is very positive as it means there is less variation in phonics outcomes across the country, which suggests there are fewer cold spots where pupils are not getting the secure foundation in phonics to help them to learn to read.
The fact that the lowest performing groups of LAs in 2012 have made greater than average progress perhaps should not come as a total surprise. After all, as illustrated in Figure 3, they had more scope to make progress towards the 100 per cent ceiling than the stronger performing groups of LAs from 2012. Nonetheless it is encouraging to see that this has happened and the gap has largely closed.
Another interesting observation from Figure 3 is the bunching of the quintiles’ average outcome scores. It appears that as LA scores reach around the 80 per cent mark, their improvement slows as schools find it increasingly difficult to get the remaining pupils up to the required standard. As the amount of effort required to get more pupils to the expected standard increases, it is likely that growth will start to slow and some LAs’ PSC outcomes will plateau or even decrease depending on the ability of the cohort from one year to the next. Indeed, the 2017 results may be showing signs that this is already starting to happen as the rate of growth in the proportion of pupils achieving the expected standard in phonics has slowed between 2016 and 2017. Also 25 LAs have seen a fall in their PSC outcome in the latest year, compared to only seven LAs in the four years up to 2016. All but two of these 25 LAs had PSC outcomes of 80 per cent or more in 2016. The challenge for schools and LAs going forward will therefore be to maintain and even try to further improve their current performance.
But that is for the future. Now we should celebrate improved phonics results for the fifth year in succession. This is indeed good news for the young readers in our schools!